Playbooks: Return on Investment
- 27 Mar 2024
- 2 Minutes to read
-
Print
-
DarkLight
Playbooks: Return on Investment
- Updated on 27 Mar 2024
- 2 Minutes to read
-
Print
-
DarkLight
Article Summary
Share feedback
Thanks for sharing your feedback!
Overview
The Playbooks Return on Investment (ROI) feature allows ThreatConnect® users to view and visualize the return on investment for the Playbooks executed in their Organization—that is, how much money and time each execution of a given Playbook has saved them (versus doing all of the tasks in the Playbook manually, without orchestration) over various periods of time. It also provides the total number of executions of a Playbook over the selected time period.
Before You Start
| Minimum Role(s) | Organization role of Standard User |
|---|---|
| Prerequisites | A Playbook that has been created |
Configuring ROI
Create a new Playbook, or open a Playbook in Design Mode. Click the Settings  icon in the upper-right corner of the Playbook Designer to display the Settings menu (Figure 1).
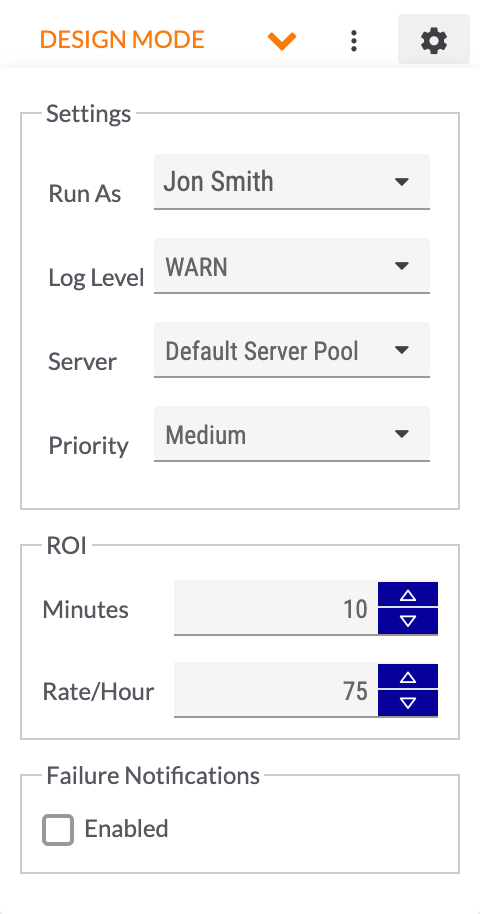
In the ROI section, enter the number of minutes of analyst time that will be saved with each execution of the Playbook in the Minutes box. Enter the analyst’s hourly pay rate in the Rate/Hour box. Every time the Playbook executes, these values will be used to calculate how much time and money were saved by executing the Playbook rather than having the analyst perform the work manually.
Note
The values set in the ROI section are specific to each Playbook. Different values may be set for different Playbooks.
Click anywhere outside the Settings  menu to save the values and close the menu.
Viewing ROI
Click  Summary on the side navigation bar of the Playbook Designer to display the Summary pane (Figure 2).
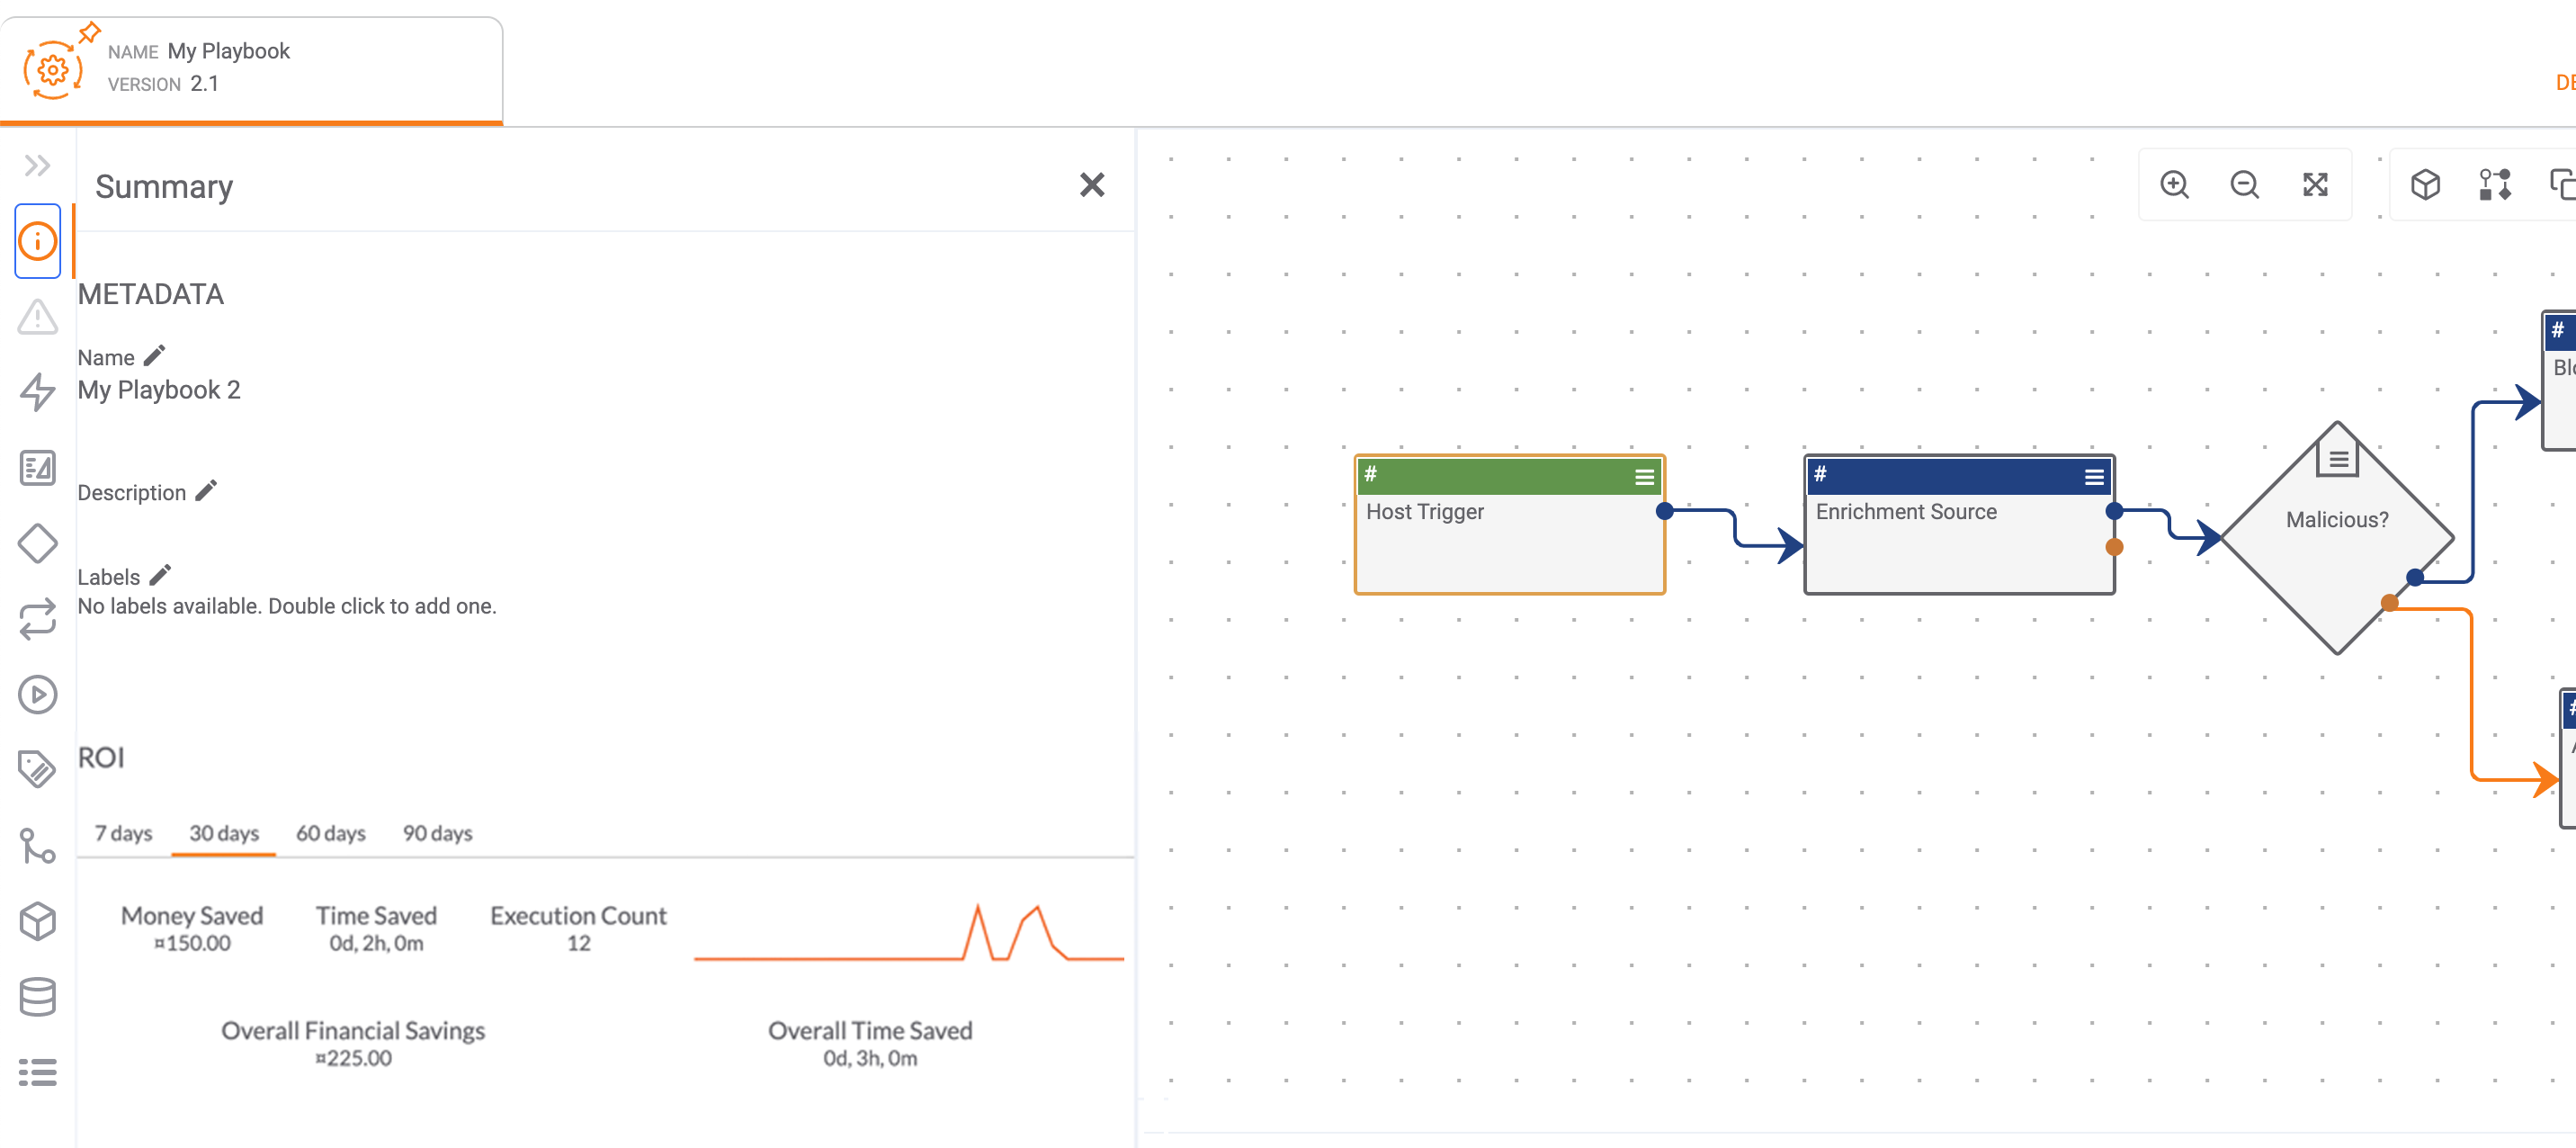
The four tabs in the ROI section provide ROI information for the given period of time (7 days, 30 days, 60 days, 90 days):
- Money Saved: the amount of money that all executions of the Playbook over the given time period have saved.
- Time Saved: the amount of time (days, hours, minutes) that all executions of the Playbook over the given time period have saved.
- Execution Count: the number of executions of the Playbook over the given time period.
- Execution Count Graph: a graph depicting the number of executions of the Playbook over the course of the given time period.
- Overall Financial Savings: the overall amount of money that all executions of the Playbook have saved over its entire existence.
- Overall Time Saved: the overall amount of time (days, hours, minutes) that all executions of the Playbook have saved over its entire existence.
Note
Overall Financial Savings and Overall Time Saved will display the same data regardless of which tab has been selected.
ROI information can also be viewed on the Playbooks screen by clicking the graph  icon in the ROI column for a Playbook.
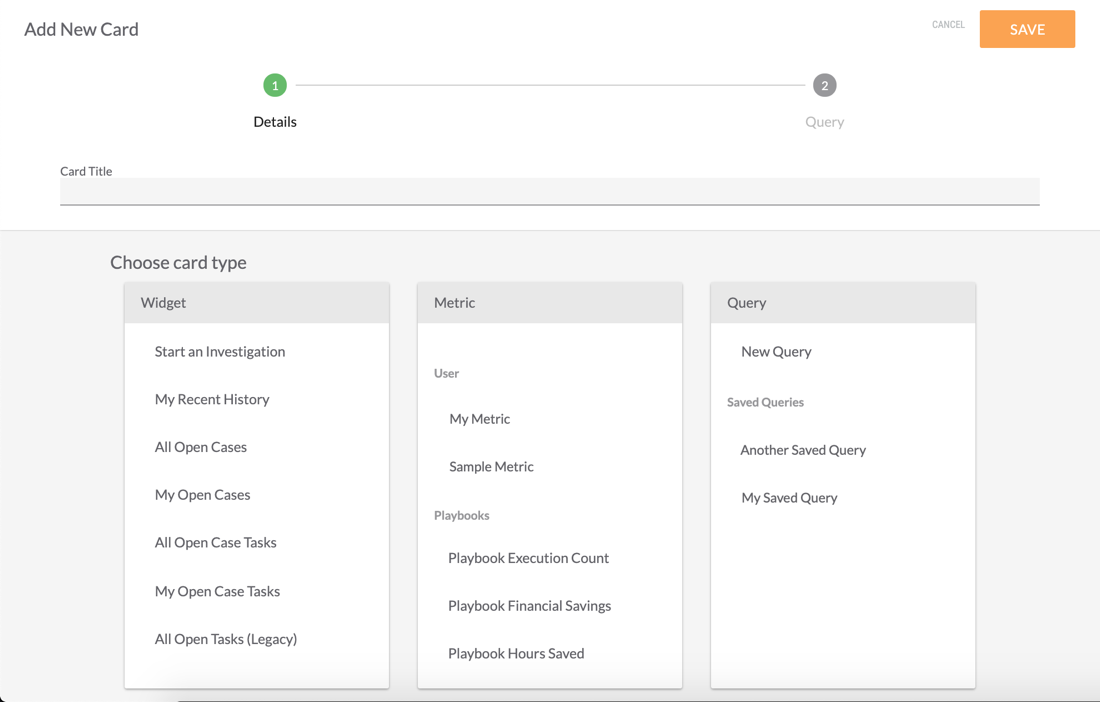
Playbook ROI Metrics
Playbook ROI Metrics are available on Dashboard Metric cards. Scroll down the Metric card types to the Playbooks sub-section (Figure 3). The available Playbook ROI Metrics are Playbook Execution Count, Playbook Financial Savings, and Playbook Hours Saved.
ThreatConnect® is a registered trademark of ThreatConnect, Inc.
20073-01 v.02.C
Was this article helpful?