The Diamond Model
- 11 Apr 2024
- 4 Minutes to read
-
Print
-
DarkLight
The Diamond Model
- Updated on 11 Apr 2024
- 4 Minutes to read
-
Print
-
DarkLight
Article Summary
Share feedback
Thanks for sharing your feedback!
Overview
The ThreatConnect® object model is based around two central concepts: associations and pivots. These two concepts express the navigations enabled by the Diamond Model of Intrusion Analysis.
Before You Start
| Minimum Role(s) | None |
|---|---|
| Prerequisites | None |
The Diamond Model of Intrusion Analysis
The Diamond Model (Figure 1) is an elegant way to abstract the pieces of a cyberattack, although often only a subset of the four vertices—Adversary, Capabilities, Infrastructure, and Victim—is presented. For example, log-file analysis may indicate that a server (the Victim) was targeted by a Shellshock attack (the Capability) emanating from a Russian IP address (the Infrastructure).
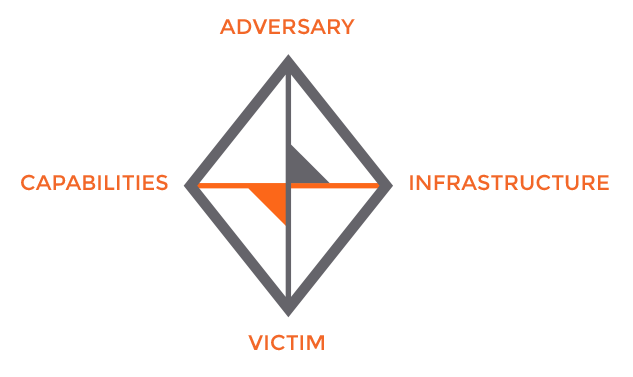
By assembling these puzzle pieces over time, it becomes easier to understand correlations in order to create complete Diamonds. That Russian IP address may have been linked to an advanced threat actor in an intelligence feed. That actor may have a long list of other known infrastructures, and Shellshock may be the precursor to further capabilities, which have been demonstrated by other Victims in a user’s industry sector.
The logical deductions derived from traversing the Diamond are referred to as pivots. They are a central part of conducting analysis within ThreatConnect and require that all of these vertices and edges be modeled appropriately.
Associations
Associations are the mechanism through which ThreatConnect models a relationship between two objects. Analysts and automated processes must create associations so that ThreatConnect can portray the relationship between two objects via a pivot.
For example, consider a breach in which malware within a company’s network is exfiltrating data to an IP address. In this example, certain fragments of the Diamond Model are already known: the Victim (the company), the Capabilities (the malware), and the Infrastructure (the IP address to which the malware calls out). These relationships can be modeled in ThreatConnect so that other members of a user’s Organization or Community can benefit from that user’s analysis. Figure 2 displays associations created between entities.
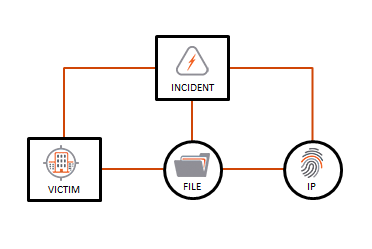
In this example, there are a total of five associations:
- Three associations between a parent Incident Group and the other entities. These associations facilitate the process of contributing to a Community or Source, so that the entire Incident (and its associated entities) can be shared with peers.
- One association between the Victim and the File Indicator. The Victim can be as granular as a specific employee (e.g., John Doe, identified by john.doe@acme.com) or as broad as an entire business unit, such as “Accounting.” Regardless of the level of detail, this association denotes that this particular File was observed in connection with that particular Victim Group.
- One association between the File Indicator and the Address Indicator to which it is exfiltrating data. This is a special type of association created as part of File behavior.
With these created associations, future analysis, both manual and automated, can uncover connections and correlations by conducting pivots across the dataset.
Pivoting
Modeling associations is of no use without any way to find the associations. Imagine that the foregoing Incident was contributed to a Community and that other analysts in the industry have discovered an entire group of activity based on the kernel of initial intelligence detailed previously. Thanks to the work of the Community as a whole, the EVILSAUCE Threat has been modeled as depicted in Figure 3.
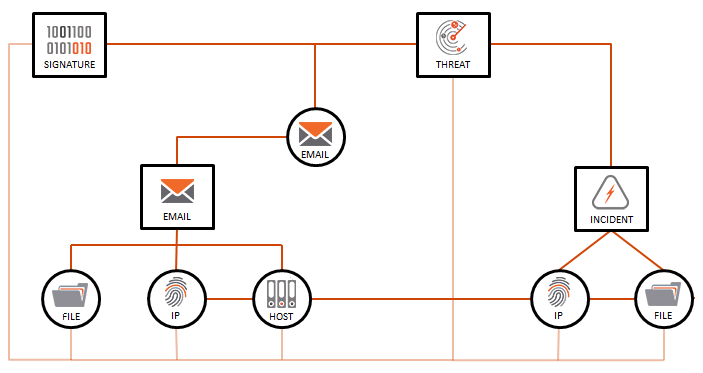
Based on collaborative analysis, the graph is now built further out because of the following chain of events:
- An Organization contributed the Incident (on the right) to a Community, as detailed in the Associations section.
- Using Passive DNS, other analysts discovered that the exfiltration IP Address used by the malware historically resolved to a hostname. This hostname currently resolves to a new IP Address, as seen on the left.
- The new IP Address, now known to be malicious, was run through defensive network devices across all partners in a Community, which yielded an alert that identified a suspicious Email Group containing a new suspicious file.
- The suspicious Email Group offers a thread for analysts to pull that may bring them closer to discovering the actor responsible for perpetrating these attacks. This set of connections is modeled as a Threat Group.
- In order to enable easier analysis and discovery, all Indicators have been associated to the parent Threat Group. An analyst in the Community also created a YARA Signature to search for the associated Indicators, and the analyst associated all objects appropriately.
Modeling for Manual Pivots
Analysts can pivot manually through the dataset in order to discover relationships, and pivots can be chained to explore relationships and find correlations. Pivoting on Data details the way this pivoting can be conducted within ThreatConnect.
The example given in this article is a great model for manual pivots, because it enables analysts to find connections easily:
- Threat intelligence analysts can now pivot off of the existing Indicators across datasets to find new Indicators (e.g., pivot off the Host Indicator to find any additional Incidents or emails in which the Host was involved).
- If the EVILSAUCE Signature is deployed and detects a hit, Security Operations Center (SOC) analysts can pivot to learn more about the EVILSAUCE Threat and easily find additional Indicators or attack vectors and thus remain proactive.
- If malicious files are found, Incident Response Analysts can pivot to discover other warning signs or Indicators of Compromise.
Modeling for Automatic Pivots
Pivots are also accessible programmatically via ThreatConnect’s Application Programming Interface (API), allowing software to traverse the graph in Figure 3 at impressive speeds and scales. This kind of pivoting can be carried out to answer interesting questions with software integrations:
- What other Indicators are related to the Indicator for which a Security Information and Event Management (SIEM) just issued an alert?
- How many Threat Groups are being tracked that are tagged as “Russia”?
- Has this Indicator already been seen in any Incidents or suspicious emails?
The foregoing questions are sample pivots, articulated in everyday language, that are enabled by modeling content with associations.
ThreatConnect® is a registered trademark of ThreatConnect, Inc.
20033-01 v.06.A
Was this article helpful?